Ask any experienced trader what indicator they rely on most, and you’ll often hear three letters: RSI.
The Relative Strength Index (RSI) is one of the simplest and most powerful tools for identifying momentum shifts, timing reversals, and making smarter entries and exits. In this upgraded guide, you’ll learn how RSI works, how to calculate it (don’t worry — it’s easier than it looks), and how to use it confidently within an algorithmic or AI-powered trading workflow.
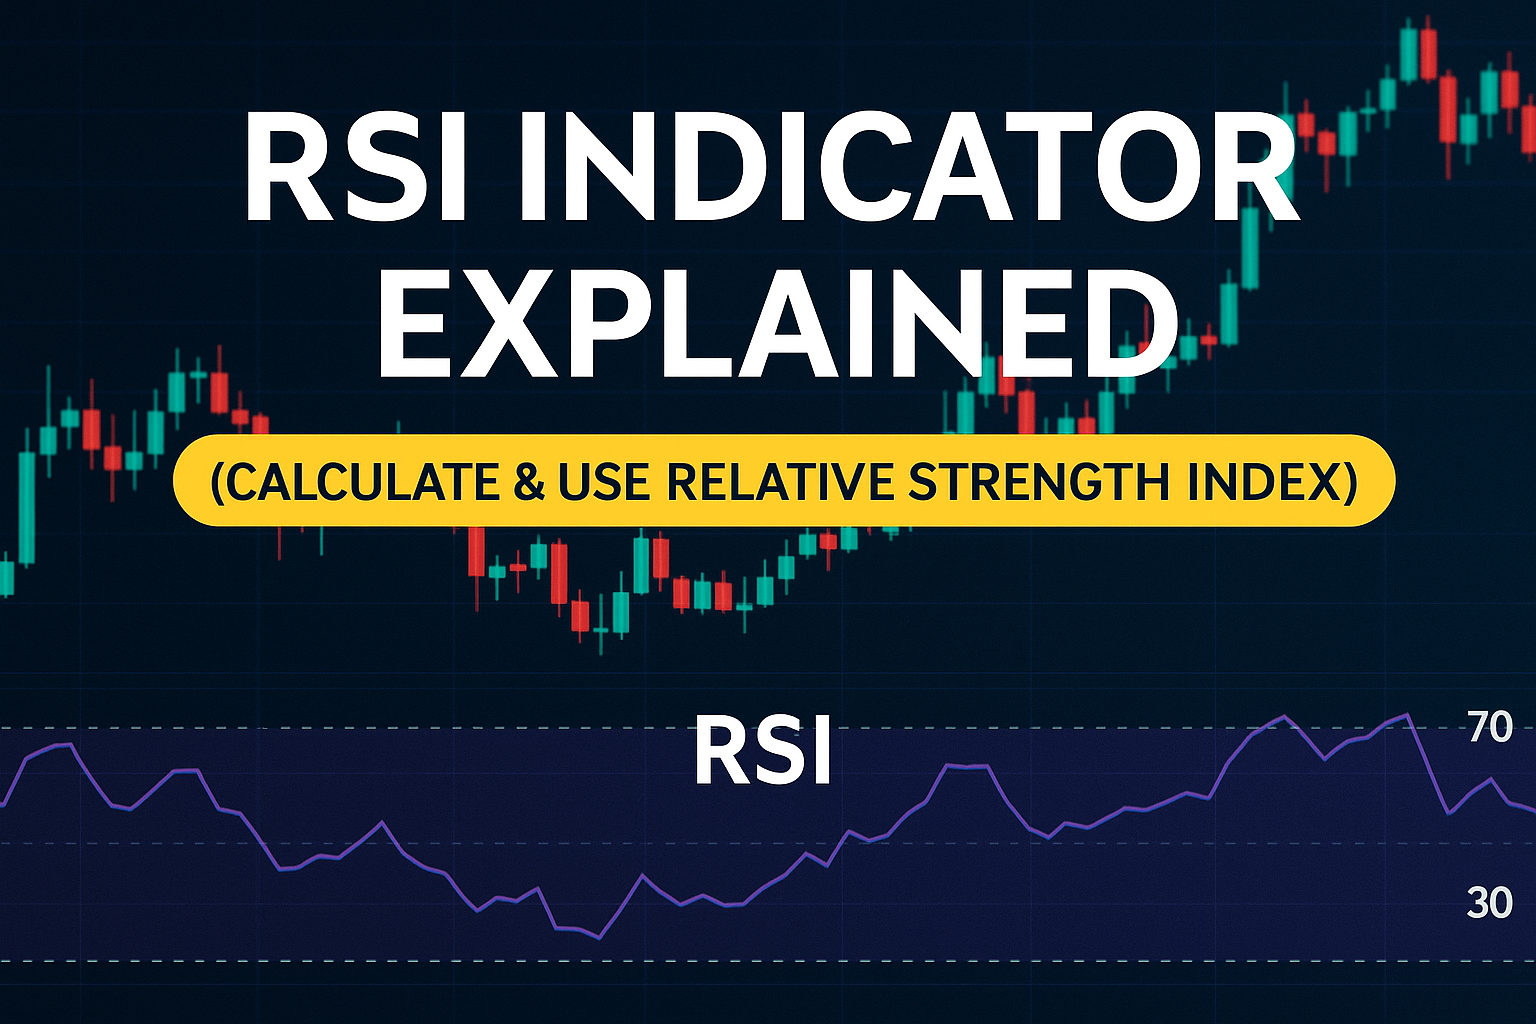
What Is the RSI (Relative Strength Index)?
RSI is a momentum oscillator that measures how fast and how far prices have moved recently. It outputs a value between 0 and 100, which helps you determine whether an asset is overbought, oversold, or in a neutral state.
-
Above 70 = Overbought (price may drop soon)
-
Below 30 = Oversold (price may bounce)
-
Around 50 = Neutral zone, often used for trend confirmation
Originally developed by J. Welles Wilder Jr. in the 1970s, RSI remains a foundational tool for both forex and crypto traders.

How to Calculate RSI (Without the Headache)
Here’s the formula:
RSI = 100 − [100 ÷ (1 + RS)]
RS = Average Gain over 14 periods ÷ Average Loss over 14 periods
Let’s break it down:
-
Choose a timeframe (14-period is standard)
-
Calculate average gain and average loss over that timeframe
-
Divide gain by loss to get RS
-
Plug RS into the RSI formula
Example:
Average gain = 1.2%
Average loss = 0.6%
RS = 1.2 / 0.6 = 2
RSI = 100 − (100 / (1 + 2)) = 66.67
Most platforms like TradingView, MetaTrader, or Binance calculate this automatically, but understanding what’s under the hood helps you trade smarter.

Key RSI Levels to Know
These levels aren’t “buy/sell now” triggers — think of them as zones of interest:
-
70 and above → Overbought: Watch for a potential pullback
-
30 and below → Oversold: Watch for a potential bounce
-
50 → Midline: Indicates bullish or bearish momentum
Use these levels alongside other tools like trendlines or support/resistance for better accuracy.
How Traders Use RSI in Real-Life Setups
1. Spotting Reversals
When RSI is overbought (above 70) and price nears resistance, a sell-off may follow.
When RSI is oversold (below 30) near support, a bounce is likely.
Example: RSI dips below 30 on BTC/USD while price sits at a strong support zone. A long entry here often provides solid risk/reward.
2. Trend Confirmation
-
RSI above 50 = bullish momentum
-
RSI below 50 = bearish momentum
This helps traders avoid countertrend mistakes and ride moves longer.
3. RSI Divergence
Divergence occurs when price and RSI move in opposite directions — a key reversal signal.
-
Bullish divergence: Price makes lower lows, RSI makes higher lows
-
Bearish divergence: Price makes higher highs, RSI makes lower highs
When this occurs near a key level, it’s often a reliable setup.
Pro Tips for Using RSI Effectively
-
Combine RSI with support/resistance, trendlines, or MACD for confirmation
-
Look for RSI divergence plus price action confluence (e.g., a bullish engulfing candle)
-
RSI works best in ranging markets — in strong trends, overbought/oversold can persist
-
Use multiple timeframes (e.g., 1H and 4H) to confirm signals
-
If you’re using algorithmic or AI-based trading systems, you can code RSI triggers, divergences, or zone alerts directly into your logic
How AI & Algorithmic Trading Supercharge RSI Strategy
Manual chart scanning can be slow and inconsistent. That’s why AI and algorithmic trading tools have become game changers — especially when paired with RSI strategies.
AITradingSignals.co provides tools that:
-
Scan thousands of charts for RSI reversals and divergences
-
Combine RSI with other data points (volume spikes, sentiment, patterns)
-
Detect when RSI is about to break key zones (like 30 or 70)
-
Send real-time alerts with confirmation signals so you never miss an opportunity
Example Alert:
“ETH showing bullish RSI divergence on 4H timeframe + volume surge — potential breakout setup.”
This is where AI-driven automation helps you act faster and with more confidence. Instead of spending hours chart watching, let the system find setups for you.
FAQs: RSI Indicator Basics
Q: What timeframe works best for RSI?
A: The 14-period RSI works well on 1H, 4H, or Daily charts depending on your strategy.
Q: Is RSI good for day trading?
A: Absolutely — many day traders use RSI on 5m, 15m, or 1H charts, especially when paired with price action.
Q: Can I use RSI by itself?
A: You can, but it’s best used with other tools like support/resistance or MACD for more reliable setups.
Q: Is RSI accurate in volatile markets?
A: It can work, but be cautious. In trending markets, RSI may stay overbought/oversold for longer, leading to false signals.
Final Thoughts: RSI Simplified and Amplified
The RSI is a powerful, beginner-friendly tool that works in both forex and crypto markets. It gives clear signals about momentum, potential reversals, and trend confirmation — and when paired with AI or algorithmic tools, it becomes even more powerful.
Want to trade RSI smarter and save hours of screen time?
👉 Explore our full RSI scanning system and step-by-step guide at AITradingSignals.co
We also offer a complete trading course and indicator combo on Gumroad tailored to your preferred market (forex or crypto), with code, strategy rules, and market-specific insights.
Disclaimer: This content is for educational purposes only and does not constitute financial advice. Trading involves risk. Always use proper risk management and do your own research.
This was such a clear and helpful breakdown, thank you! I’m just starting to dip my toes into trading, and honestly, I don’t know much yet. I mostly rely on group chats and posts from more experienced members to guide me. I keep seeing the terms “overbought” and “oversold” pop up, especially when people talk about RSI, but I never fully understood what they meant until now.
It’s fascinating how a single number can offer so much insight into market momentum. I’m curious, how do traders decide which timeframe to use for RSI? I’ve seen people mention 1H and 4H, but I’m not sure how that changes the signal or strategy.
Appreciate the way you simplified the math and added real-life examples. It makes the learning curve feel a little less steep!
Thanks so much—glad it helped! ????
“Overbought/Oversold” makes way more sense once you see RSI as context, not a standalone “buy/sell” button.
Here’s a simple way to pick timeframes (and what changes when you do):
1) Set your bias on a higher TF (1D or 4H).
Use RSI “range rules”: in uptrends, RSI tends to live 40–90; in downtrends 10–60.
If 4H/1D holds above ~40, treat dips as pullbacks, not trend reversals.
2) Find entries on a mid TF (1H or 15m).
Look for price pulling into a clear level (prior high/low, support/resistance, 20/50 EMA).
In an uptrend, RSI pulling back to 40–50 at that level is healthier than waiting for a perfect 30.
In a downtrend, the mirror (RSI 50–60 at resistance).
3) Only drop lower (5–3m) to fine-tune timing—optional.
Use it to wait for a small structure break or wick rejection; don’t let tiny TFs change your higher-TF plan.
How timeframe changes the signal/strategy:
4H/1D RSI: slower, more reliable trend context; fewer signals, bigger swings.
1H/15m RSI: more signals, good for entries aligned with the higher-TF bias.
3–5m RSI: timing tool; highest noise.
Quick starter playbook (copy/paste):
Mark a trend on 4H (RSI > 40 = bullish bias).
Wait for 1H pullback into a support zone.
Check 1H RSI ~40–50 and a bullish candle.
Enter with stop just beyond the zone; first target = recent swing.
If you like, I can share a couple of annotated screenshots showing this exact sequence on 4H → 1H. You’ve got this—one clean setup repeated beats ten noisy ones any day. ????
This was a solid breakdown of how RSI works. I’ve seen many traders rely on indicators they barely understand, but your explanation made it easy to follow. I like how you pointed out that RSI shouldn’t be used alone, especially in strong trends where false signals can happen. That reminder could save a lot of beginners from making impulsive trades. And to be honest, I have little to no experience with this subject. I’m a learner.
However, I personally think RSI shines most when combined with clear price action zones. It gives you that balance between data and intuition. What’s your preferred time frame for using RSI effectively? Is it short-term trades or longer trend confirmations? I’d love to learn more about this. Thanks for sharing your knowledge and experience in this masterpiece.
John Monyjok Maluth
Hey John — really appreciate the thoughtful note ????
You’re spot on: RSI gets way more powerful when you anchor it to clean price-action zones. Quick rundown of how I use it:
Timeframes (my go-tos):
• Trend context: 1D (and 6H) to see if we’re in a bull/bear RSI range (bull: ~40–90, bear: ~10–60).
• Setups: 15m & 45m for high-quality entries on crypto/forex; they filter a lot of noise.
• Execution/precision: 3m (sometimes 1m) only after the higher TF says “yes.”
Zones + RSI playbook:
Mark prior swing highs/lows, supply–demand, VWAP, or 20/50 EMA pockets.
In an uptrend, I like RSI pullbacks into 40–50 at a support zone → look for a rejection wick or small bullish structure break.
In a downtrend, mirror it: RSI 50–60 into resistance.
Divergences matter most at those zones (not in the middle of nowhere).
Manage risk first: stop just beyond the zone; scale out at prior structure; invalidate if RSI loses the bull/bear range (e.g., uptrend loses 40 with momentum).
RSI lengths I like:
• Scalps (1–3m): 7–10 length (snappier).
• Intraday (15–45m): classic 14.
• Swing (1D): 14 with 40/60 “range rules” (instead of only 30/70).
Short answer to your question: I prefer 15m & 45m for entries/confirmations, with 1D setting the bias, then I’ll fine-tune on 3m if needed.
If you’re learning, you’re in a great spot—start with one setup: “Trend up, price pulls into a marked support, RSI holds ~40–50, bullish candle confirms.” Run 20 screenshots of just that. The confidence comes fast.
Happy to share a few chart examples if you want. Thanks again for the kind words, John!