When markets get quiet, they often explode next. Bollinger Bands (BB) help you see it coming. This popular volatility tool wraps around price to show how stretched (or squeezed) the market is.
In this guide, you’ll learn how BBs work, how to read them, and exact trading playbooks—from squeeze breakouts to band rides and mean reversion—plus risk rules, backtesting steps, and AI workflows to find A‑grade setups fast.
Related on Indicators101:
- Price Action Trading Basics (Support/Resistance Breakouts)
- Using Volume Indicators to Confirm Breakouts
- How to Combine Multiple Indicators (Without Overloading)
- How to Build & Backtest a Strategy in TradingView
Promise: By the end, you’ll have copy‑ready rules for squeeze breakouts, trend continuations (band rides), and mean‑reversion entries—backed by ATR‑based risk, momentum/volume confirms, and automation ideas.
📊 What Are Bollinger Bands?
Developed by John Bollinger, BBs consist of three lines:
- Middle band: 20‑period Simple Moving Average (SMA)
- Upper band: SMA + 2 standard deviations
- Lower band: SMA – 2 standard deviations
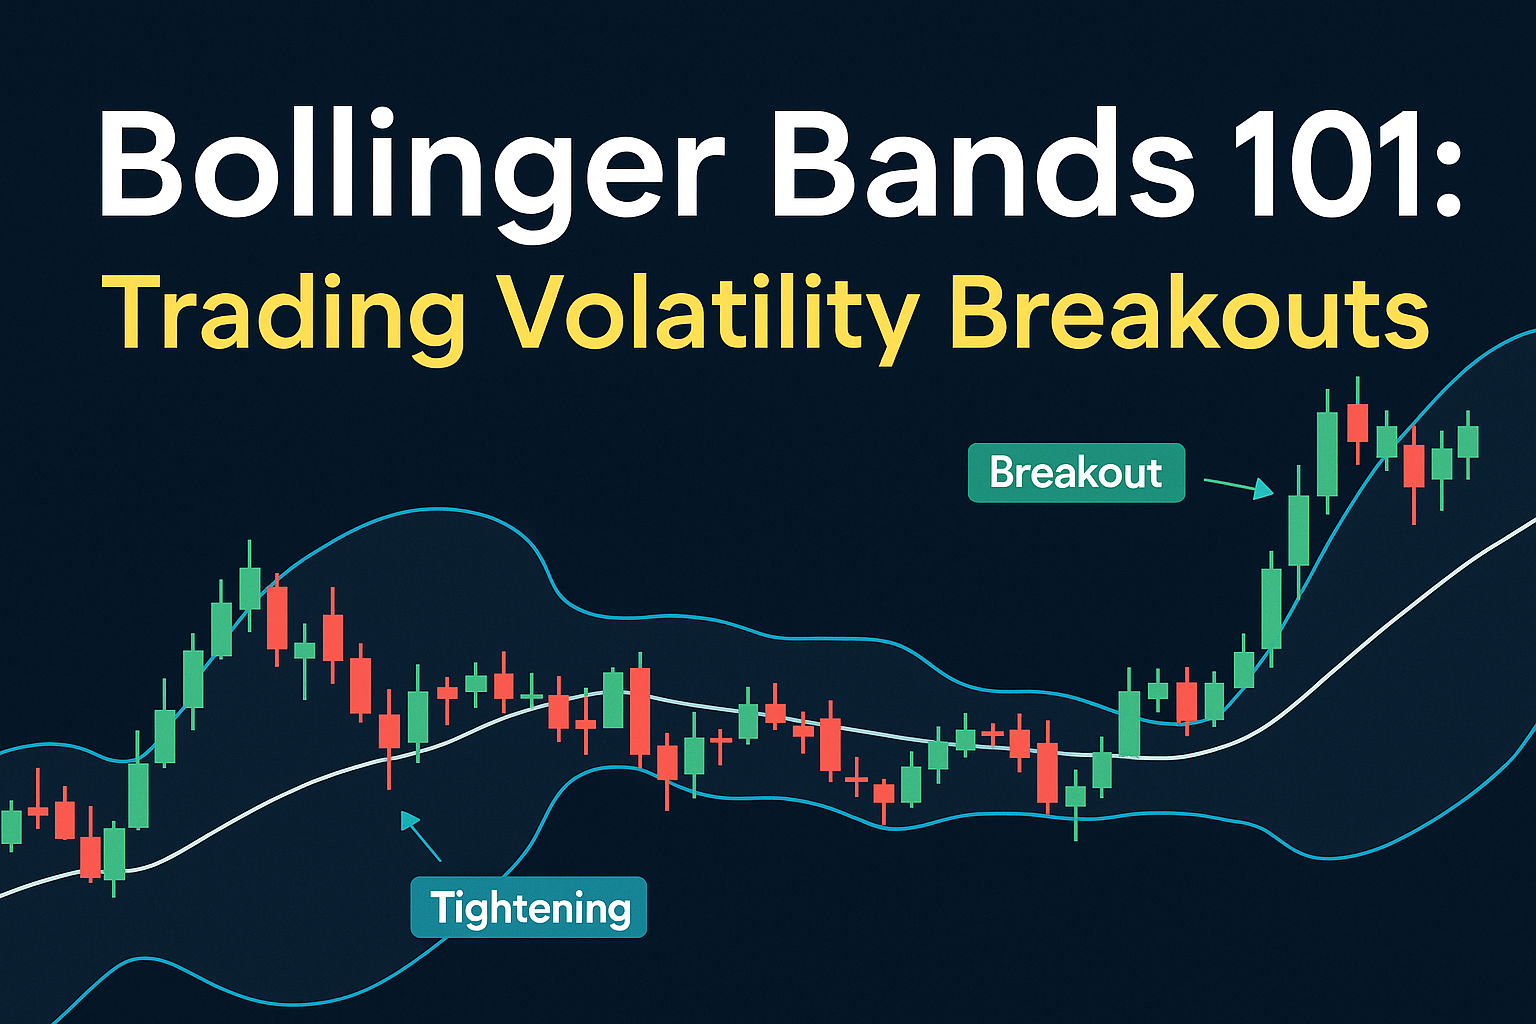
The bands expand when volatility rises and contract when it falls. This makes them ideal for detecting compression (squeeze) and expansion (breakout) cycles.
Default settings: BB(20, 2). You can adjust the length (e.g., 10–25) and deviation (1.5–2.5) after testing.
Bonus metric: BandWidth = (Upper − Lower) / Middle. Use it to quantify squeezes.
🚫 The Squeeze: Quiet Before the Storm
A BB Squeeze happens when bands get unusually tight—often before a range breaks.
How to spot it:
- Bands narrow significantly
- Price trades sideways near the middle band
- Volume often dries up before the move
- BandWidth drops into its bottom 20–30% of the past 6–12 months (objective rule)
How to trade it (framework):
- Wait for the break: Close above upper band (bullish) or below lower band (bearish).
- Confirm: Momentum (e.g., RSI > 50 for longs, <50>MACD line crosses zero; add RVOL ≥ 1.5–2.0 when available.
- Enter: On the breakout close or a 25–40% pullback into the breakout candle.
- Stop: Opposite side of the base or breakout candle ± ATR(14) buffer (0.3–0.7× for intraday; up to 1.5× on higher TFs).
- Targets: 1×–2× base height; partial at +1.5R; trail remainder with 1.5× ATR.
Tip: If the breakout runs straight into a heavy volume node or major resistance, prefer a retest entry over immediate chase.
🏛️ Riding the Bands: Trend Continuation Setups
In strong trends, price often “rides” the band: hugging the upper band in uptrends and the lower band in downtrends. This is not a reversal signal—it’s confirmation of strength.
Rules of thumb:
- Price closes near/above the upper band → strong uptrend; favor with‑trend pullbacks to the middle band or prior swing.
- Price closes near/below the lower band → strong downtrend; favor pullback shorts.
- Avoid countertrend shorts while price rides the upper band (and vice versa).
Entry ideas:
- Pullback to middle band (20 SMA) + bullish/bearish candle + RSI bias (> 50 for longs, <50>
- Micro‑consolidation under/over the band then break with RVOL.
🚨 Mean Reversion Signals (Outside→Inside)
Price tends to revert toward the middle band after extreme stretches. The classic rule:
Setup:
- Candle closes outside the band (exhaustion signal).
- Next candle closes back inside the band (failure of extremes).
- Target: the middle band.
Best conditions: Range‑bound markets, quiet volatility regimes, or after parabolic pushes that stall.
Note: In trending markets, outside‑the‑band closes can persist. Use a trend filter (e.g., 50/200 EMA) to decide when mean reversion is appropriate.
✅ Three Complete Bollinger Band Playbooks (Copy/Paste)
Playbook A — BB Squeeze Breakout (M15–H1)
- Compression: BB BandWidth in bottom 30% of its 6–12‑month range; ATR(14) < its 20‑bar SMA.
- Trigger: Close outside the band (above for longs / below for shorts).
- Confirm: RSI(14) > 50 (longs) / <50>and/or MACD line on the correct side of zero; RVOL ≥ 1.8 preferred.
- Entry: On breakout close or 25–40% pullback into the breakout bar.
- Stop: Other side of the base or breakout bar −/+ 0.5× ATR.
- Targets: 1×–2× base height; TP1 at +1.5R (scale 40–50%, move to breakeven), TP2 trail by 1.5× ATR.
- Guards: No trades 10–15 min before high‑impact news; for crypto, reduce size if funding is extreme.
Playbook B — Band‑Ride Pullback Continuation (H1–H4)
- Bias: 50 EMA > 200 EMA (longs) or < (shorts). Price riding the relevant band.
- Setup: Pullback to middle band (20 SMA) or prior swing; small inside bar or pin bar.
- Trigger: Close back in trend direction; Stoch or RSI turns with the move (RSI > 50 / <50>
- Stop: Under/over pullback swing −/+ 1× ATR.
- Targets: Prior high/low, then ATR‑trail runner.
- Guards: Skip if ATR percentile is already high (late trend) or if momentum diverges.
Playbook C — Outside→Inside Mean Reversion (M15–H1)
- Context: Range‑biased market (50 EMA ~ 200 EMA; flat slope).
- Trigger: Candle closes outside band → next candle closes back inside.
- Entry: On the inside‑close bar.
- Stop: Beyond the extreme wick + 0.5× ATR.
- Target: Middle band; optional extension to opposite band if momentum flips.
- Guards: Stand aside during news spikes; if volume remains hot, skip the fade.
🔧 Settings & Tuning (Keep It Sane)
- Start with BB(20, 2). If you want more sensitivity, use (20, 1.8–2.0) or shorten to (10–15, 2); for smoother, try (25, 2–2.5).
- Only tune inside narrow, logical ranges and validate out‑of‑sample. If performance collapses with tiny changes, it’s curve‑fit.
- Combine with ATR(14) for stop buffers and trails; with RSI(14) or MACD(12/26/9) for momentum confirmation.
🧠 Confluence That Elevates Your Signals
Use 1–2 of these—not all:
- Price structure: Prior day/week high‑low, clear support/resistance, swing structure.
- Momentum: RSI 50‑line, MACD zero‑line.
- Volume: RVOL ≥ 1.5–2.0 on breakouts; lighter volume on retests.
- VWAP/AVWAP (intraday): Reclaims confirm continuation; failures flag fake‑outs.
More filters ≠ more edge. Keep the stack lean.
📉 Risk Management (Non‑Negotiable)
- Per‑trade risk: 0.5%–1.0% on majors/BTC/ETH; 0.25%–0.75% on volatile alts.
- Stops: Beyond invalidating structure + ATR buffer (0.3–1.5× by timeframe/liquidity).
- Partials: Scale 40–50% at +1.5R, move to breakeven, then ATR trail.
- Daily/weekly caps: Stop at −3R/day or −6R/week; review before resuming.
- Correlation caps: Limit total open risk ≤ 3% and avoid stacking multiple BTC‑beta alts.
🧪 Backtesting Your BB Strategies (Do This Before Money)
- Write exact rules (entries, exits, ATR buffers, momentum/volume confirms, session/news filters).
- Model costs (spread/fees, slippage; funding for perps). Breakouts slip—size smaller.
- Test across regimes: trending, ranging, high/low ATR months; multiple assets (EURUSD/GBPUSD/BTC/ETH + one liquid alt).
- Use out‑of‑sample and walk‑forward validation; prefer parameter plateaus.
- Forward test 2–6 weeks on paper/tiny size; compare expectancy (R/trade), profit factor (>1.2), max drawdown, and trades/week to backtest.
🔢 Practical Examples (With Sizing Math)
Example 1 — BTCUSDT H1 BB Squeeze Breakout
- Equity $8,000; risk 0.5% ⇒ $40.
- BB BandWidth in bottom 30%; breakout close above upper band; RSI 54, MACD>0, RVOL 2.1.
- Stop: Breakout bar low − 0.6× ATR = 0.9%.
- Perps 3× → Notional = $40 × 3 ÷ 0.009 ≈ $13,333.
- TP1 at 1× base height; move to BE; runner trails 1.5× ATR.
Example 2 — EURUSD M15 Outside→Inside Mean Reversion
- Equity $10,000; risk 1% ⇒ $100.
- Candle closes below lower band; next closes back inside; range‑biased day.
- Stop: Below wick − 0.5× ATR = 18 pips.
- Size ≈ $100 ÷ 18 ≈ $5.56/pip (~0.56 mini lots).
- Target: Middle band; exit remainder if RSI fails to reclaim 50.
🤖 How AI Enhances Bollinger Band Trading
AI‑powered platforms like AITradingSignals.co can:
- Scan hundreds of charts for BB squeezes and band‑ride continuations.
- Combine momentum/volume confirms (RSI/MACD/RVOL) for cleaner alerts.
- Detect outside→inside reversion signals automatically.
- Backtest BB strategies by asset class and timeframe.
- Alert you in real time when rules align—so you act, not hunt.
Pro Tip: Let AI surface A‑setups; you enforce risk, review, and discipline.
❓ FAQs
Are Bollinger Bands good for crypto?
Yes. Crypto’s volatility makes BB excellent for spotting squeezes and expansions.
Which timeframe is best?
Try H1, H4, or Daily for clarity; M15–M30 for intraday. Match to your hold time.
Can I use BB with RSI?
Definitely. RSI’s 50‑line adds a simple momentum bias to confirm breakouts.
What causes a squeeze?
Sustained low volatility and sideways compression—often before news or after an extended move.
Should I fade every outside‑the‑band close?
No. In trends, those closes can persist. Use a trend filter and the outside→inside rule.
🚀 Final Thoughts: Trade the Quiet Before the Storm
Bollinger Bands let you visualize volatility like few tools can. Watch for squeezes, breakouts, and band rides to time high‑quality trades. Keep the stack lean (structure + BB + one confirm), size from ATR‑based stops, and let automation do the scanning.
Call to Action: Want AI to find volatility setups for you? Give our Indicators a try at AITradingSignals.co for BB squeeze scanners, momentum/volume confirms, and ATR‑based risk tools. Prefer a guided path? Check out our courses at aitradingsignals.gumroad.com for step‑by‑step strategies and backtesting labs.