How to analyze charts, set alerts, use indicators—and plug into AI & algorithmic trading
| Skill level: Beginner to intermediate (Forex, Crypto, Stocks)
🔍 Introduction: Your Trading Toolkit Starts Here
TradingView is one of the most powerful charting platforms around—and it’s free to start. If you’re new to forex, crypto, or stocks, this guide shows you exactly how to use TradingView to analyze charts, track indicators, set alerts, and make more consistent, rules‑based decisions.
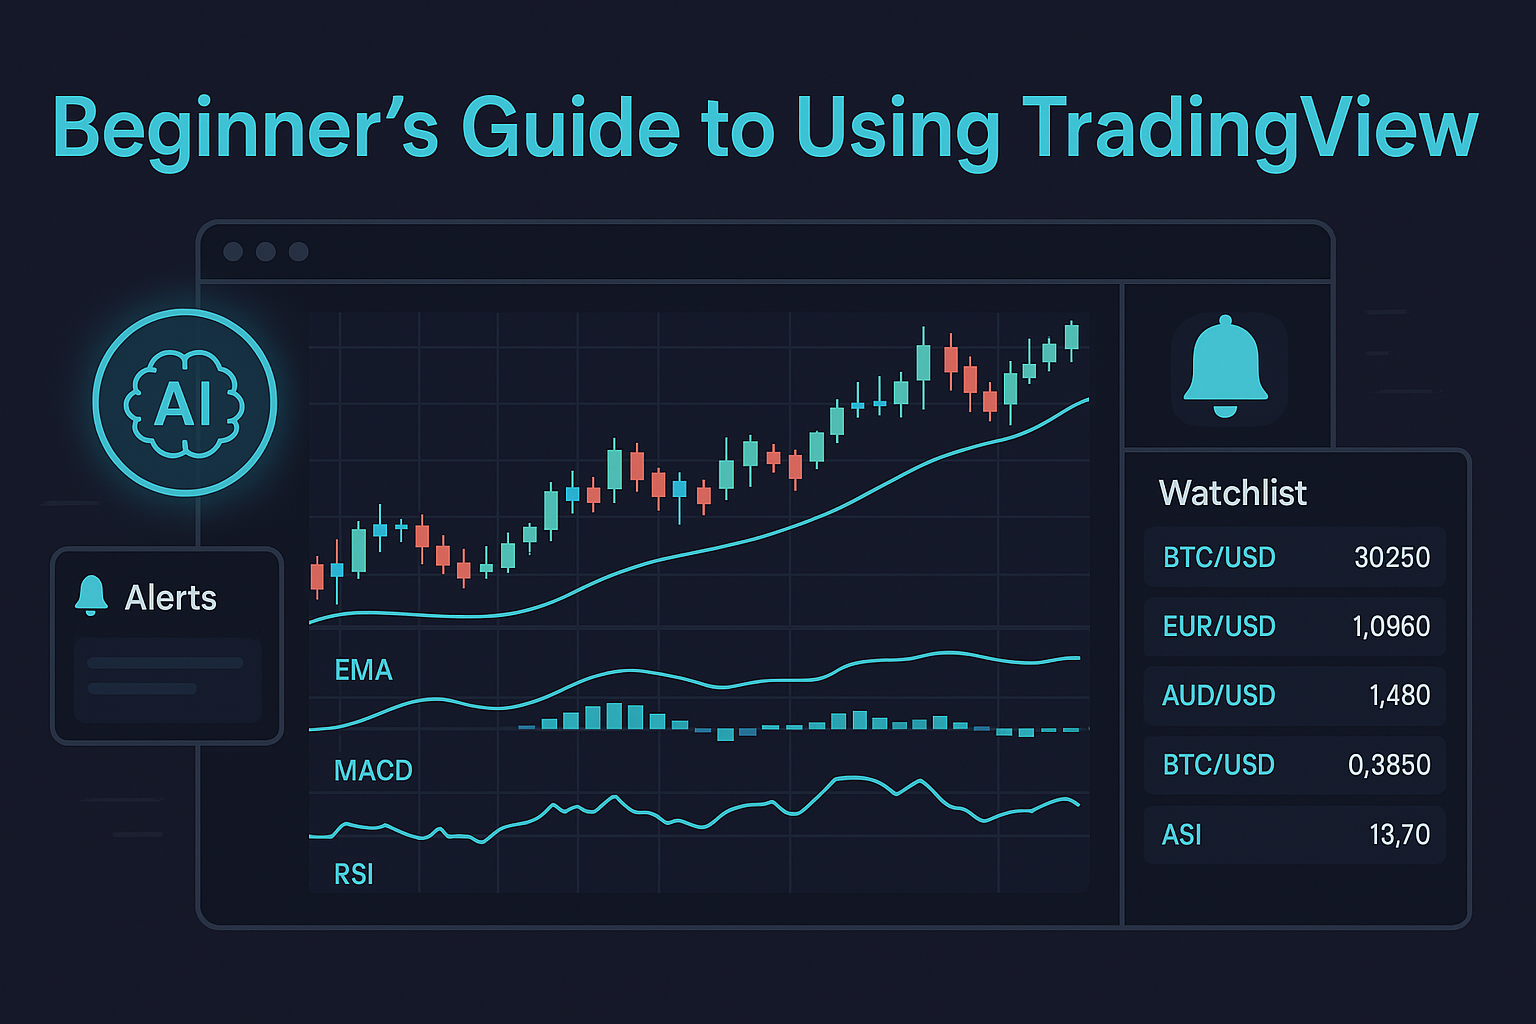
Quick scenario: Bitcoin starts to surge. Instead of guessing, you open TradingView, pull up BTCUSD, add a 20 EMA and RSI, and spot a pullback with RSI bouncing from oversold. Now you have a structured setup—not a hunch.
This guide also shows how TradingView fits into AI trading and algorithmic trading workflows, so you can scale from manual analysis to semi‑automated signal‑driven execution.
🎯 What Is TradingView?
TradingView is a web/mobile charting platform that lets you:
- Analyze price action with professional charts
- Use popular indicators and backtest strategies
- Create alerts and manage watchlists
- Share ideas and follow other traders
- Build custom tools with Pine Script
It’s fast, intuitive, and supported by a massive social community. You can publish ideas, get feedback, and even connect select brokers to place trades directly from the platform.
Resources:
- TradingView Home: https://www.tradingview.com/
- Pine Script® Reference: https://www.tradingview.com/pine-script-docs/en/v5/
🛠️ Getting Started: Set Up Your First Chart
Follow these three quick steps to get from zero to charting in under five minutes.
Step 1 — Create a Free Account
- Go to tradingview.com
- Sign up with email, Google, or Apple
- Confirm your account and log in
Step 2 — Open a Chart
- Click Chart in the top menu
- Use the symbol search for your market (e.g., EURUSD, BTCUSD, AAPL)
- Select a timeframe (start with 1H or 4H)
Step 3 — Customize Your Layout
- Change candle colors, background, and session breaks
- Add volume, indicators, and drawing tools
- Click Save Layout (cloud icon) to keep your preferences
Pro tip: Start with a clean chart. Fewer indicators = faster decisions.
📊 Add the Right Indicators (RSI, MACD, Moving Averages)
How to add an indicator:
- Click Indicators at the top
- Type RSI, MACD, or Moving Average
- Click to add; then open the gear icon to edit settings
Beginner‑friendly indicators:
- RSI (Relative Strength Index): Finds potential overbought/oversold zones (commonly set to length 14; watch 30/70 levels)
- MACD: Momentum and trend confirmation (watch MACD line crossing signal line and zero‑line shifts)
- EMA/SMA: Smooth trend direction (popular: 20 EMA for short‑term pullbacks, 50 EMA for swing bias)
Customization tips: Right‑click any line to adjust color/visibility and keep your chart readable.
Mini Playbook: RSI + 20 EMA Pullback
- Bias: If price is above the 50 EMA, look for long pullbacks to the 20 EMA
- Trigger: RSI dips near 30–40 then curls up; bullish candle forms at/near the 20 EMA
- Risk: Stop below the swing low; target prior high or 1–2R
- Filter: Avoid trades into obvious resistance or major news
⏰ Alerts & Watchlists: Never Miss Your Level
Create an alert:
- Right‑click on price/indicator → Add alert
- Choose the condition (e.g., RSI crossing 30, Price crossing level)
- Pick notification type (app, popup, email, SMS—plan dependent)
Build a watchlist:
- Add your favorite symbols (e.g., BTCUSD, ETHUSD, EURUSD, XAUUSD)
- Group by asset class, session, or strategy
- Use color tags to label volatility or priority
Workflow tip: Create alerts at your planned entry areas—let TradingView do the waiting for you.
✏️ Drawing Tools: See Structure Clearly
Use the left toolbar to add:
- Trendlines for swing structure
- Support/Resistance zones (rectangle tool)
- Fibonacci retracements for pullback levels (38.2% / 61.8%)
- Patterns (e.g., triangles, head & shoulders)
How to draw well:
- Click the tool, then click‑drag on the chart
- Open Properties to set style/coords
- Label your drawings so future‑you understands your past analysis
Common mistake: Overdrawing. Too many lines = analysis paralysis. Focus on high‑probability zones.
🧪 Power Features to Explore Next
- Bar Replay: Practice reading price action on historical data
- Pine Script®: Build or customize indicators/strategies
- Screeners: Scan for top gainers/losers or specific filters
- Multi‑charts (Pro feature): Compare assets or timeframes side‑by‑side
🤖 Where AI Trading Fits: Signals + TradingView = Speed
TradingView is your analysis hub. Pair it with AI trading signals to accelerate your workflow without skipping human confirmation.
How it works with AITradingSignals.co:
- Receive curated trade setups that combine multiple indicators (e.g., MACD + RSI + EMAs)
- See each setup’s rules so you learn as you trade—ideal for stepping into algorithmic trading
- Backtested rule sets help you focus on higher‑probability conditions instead of noise
Two ways to gain instant access:
- Via our site: Full source code + complete step‑by‑step guide → https://www.aitradingsignals.co/
- Via Gumroad: Full script + market‑specific course material (forex or crypto) + step‑by‑step guide for more precise rules → Gumroad storefront
Best practice: Let AI handle the scanning and alerts; use TradingView to confirm structure, trend, and risk before placing any trade.
✅ Pros & Cons of TradingView for Beginners
Pros
- Excellent charts and indicator library
- Easy alerts and watchlists
- Huge community and education resources
- Works on web and mobile
Cons
- Some advanced features require paid plans
- Too many indicators can slow your learning—keep it simple
🧭 Example Starter Workflow (15 Minutes a Day)
- Scan: Open your watchlist and check trend via 20/50 EMA
- Mark levels: Use rectangles for daily/4H zones
- Plan entries: Note RSI/MACD confluence near your levels
- Set alerts: At price levels or indicator conditions
- Review signals: Cross‑check with AITradingSignals setups
- Log trades: Screenshot chart and save notes for iteration
❓ FAQs: TradingView for Beginners
Is TradingView free?
Yes. The free plan covers charts, core indicators, and basic alerts. Paid plans unlock more.
Can I trade directly on TradingView?
Yes—via supported broker integrations (e.g., OANDA, Binance, and others where available).
What’s the best timeframe to learn on?
1H and 4H balance clarity and noise. Newer day traders may also observe 15m for timing.
Best indicators to start with?
RSI, MACD, and Moving Averages (EMA/SMA). Add only when a new tool solves a real problem.
Mobile app?
Yes. Great for managing alerts and quick reviews; do deep work on desktop.
How do I save my layout?
Use the cloud icon in the top‑right to save a named layout.
📌 Summary
TradingView is your home base for planning and executing trades. Master the basics—clean charts, a few high‑value indicators, smart alerts—and you’ll avoid emotional decisions, follow consistent rules, and build confidence.
Add AI trading signals to speed up discovery while you stay in control of confirmation and risk.
Next step:
- Explore our AI Trading Signals solutions:
- Full source code + step‑by‑step guide → https://www.aitradingsignals.co/
- Gumroad package with market‑specific course material (forex or crypto) + guide → https://aitradingsignals.gumroad.com/
🔒 Compliance & Risk Disclosure
This article is for educational purposes only and is not financial advice. Trading involves risk. Do your own research, use risk management, and never risk more than you can afford to lose. We do not provide personalized recommendations.